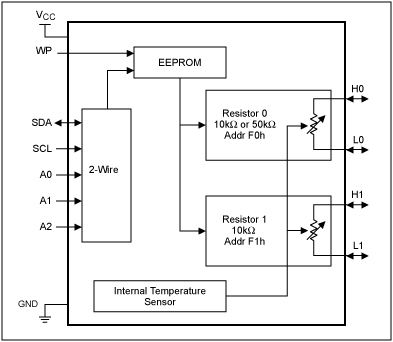
Abstract: Abstract: Both the DS1847 and DS1848 feature two 256-position digital resistors and lookup tables (LUT) to automatically adjust the resistance over a temperature range of -40°C to 95°C. The DS1848 also features 128 bytes of user EEPROM for nonvolatile (NV) storage of other data. Up to eight chips can be accessed through a single 2-wire interface, which is used to communicate with the chips. Both parts are currently in production and available for purchase. This application note explains the Temperature Coefficient (TC) of the DS1847, and in particular, why the 85OPPM/°C uncompensated TC does not apply to systems using the temperature lookup function. It also examines the accuracy of the LUT programming equation. This document is not intended to be a tutorial on how to use the DS1847 or DS1848, so please review the device datasheets before proceeding.
Both the DS1847 and DS1848 feature two 256-position digital resistors and lookup tables (LUT) to automatically adjust the resistance over a temperature range of -40°C to +95°C. The DS1848 also features 128 bytes of user EEPROM for nonvolatile (NV) storage of other data. Up to eight chips can be accessed through a single 2-wire interface, which is used to communicate with the chips. Both parts are currently in production and available for purchase.
This application note explains the Temperature Coefficient (TC) of the DS1847 and, in particular, why the 850PPM/°C uncompensated TC does not apply to systems using the temperature lookup function. It also examines the accuracy of the LUT programming equation. This document is not intended to be a tutorial on how to use the DS1847 or DS1848, so please review the device datasheets before proceeding.
Equation 1.

However, this is not the best description of TC for the DS1847. The TC is actually a function of the resistance itself. The chart on the last page of the datasheet plots the typical TC vs. resistance function. Notice that at low positions (low resistance), the TC is higher than at higher positions.
This TC function may initially cause concern, but here is a typical example to show the numbers associated with the TC vs. Resistance chart and Equation 1. The two conditions that will be looked at are a minimum resistance value and a maximum resistance value. In the case of a minimum resistance, about 500Ω for a DS1847-10, the temperature coefficient listed on the chart is 1450PPM. The resistance change caused by a 10°C temperature change can be calculated to be 7.3Ω. For the same temperature change, a 10kΩ resistor (680PPM/°C) will see a resistance change of 68Ω. The reason the higher resistance value has a greater change with temperature in spite of the lower TC is that the uncompensated resistance increased 20 fold, while the TC was reduced by approximately a factor of 2. Also realize that percentage change of the 10kΩ resistor ([68Ω*100%]/[10kΩ*10°C]) was lower 0.068%/°C versus the 0.145%/°C for the 500Ω resistor. This means that when the DS1847 is used to make small resistors it will have a lower temperature coefficient in terms of Ω/°C, and larger resistors have a lower temperature coefficient in terms of %/°C.
In the case of the 10kΩ resistor, the +68Ω resistance increase which occurred over a 10°C temperature change corresponds to a rate of +6.8Ω/°C. Thus, to stay at the 10kΩ target value the resistor's position should be decremented one position (~37Ω) every +5.6°C. Ideally, this would keep the resulting resistance within 1LSB of the target value. The 500Ω resistor works similarly, but it only requires compensation every 52°C because it has a lower temperature coefficient in terms of Ω/°C.
If the parts were ideal in the sense that every part has a minimum resistance of 500Ω and a maximum resistance of 10kΩ, the position could be calculated and compensated accurately using the method described above. Unfortunately, the process variation during the production of DS1847s and DS1848s adds another variable to complicate this even further. The maximum resistance of the DS1847/48 can change by as much as 20% from the nominal value of 10kΩ, and the TC is subject to some change over process as well. This makes it difficult to calculate the resistor position a system will require, because it is possible the process variation could cause the resistance corresponding to the ideal position to be off the targeted value by up to 20%.
To solve the problems associated with the process variation, six parameters are stored in each resistor's LUT to characterize them according to the equation provided in the Programming the Lookup Table section of the datasheet. The u, v, w, x, y, and z variables allow the user to accurately calculate what position they need to achieve a particular resistance at a particular temperature. If the entire table is programmed using the equation and these variables, the user should be within 2LSB of their desired resistance over the entire temperature range. This is why the 850PPM/°C is not necessarily relevant to the performance of the device in its normal mode of operation while using the equation. The LUT allows the resistance to be trimmed every 2°C, and a DS1847 will adjust itself to maintain the user's resistive function. The positions calculated using Equation 2 are already temperature compensating the DS1847 to within the accuracy of the equation.
Equation 2.

Equation 3.

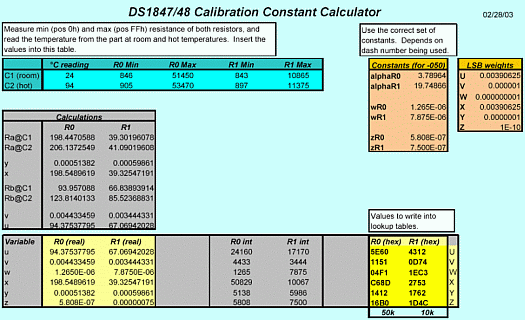
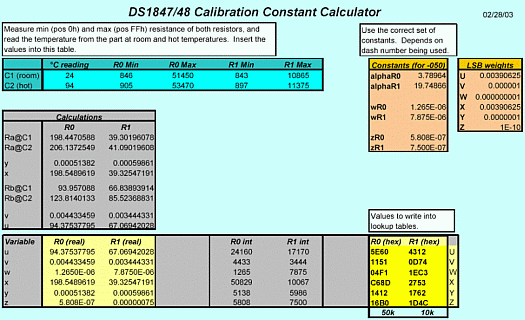
A spreadsheet is available on the Dallas Semiconductor ftp site that calculates the resistance of the part as a function of the u, v, w, x, y, and z variables, plus the alpha value from the datasheet.
Follow these instructions in order to use the spreadsheet:
Below is a chart showing an ideal temperature performance of the DS1847 when it is programmed to maintain a fixed resistor value over temperature. This chart is a theoretical performance, and it neglects that the DS1847 can only change its position every two degrees. This chart is provided to show how a DS1847 should compensate itself over temperature.
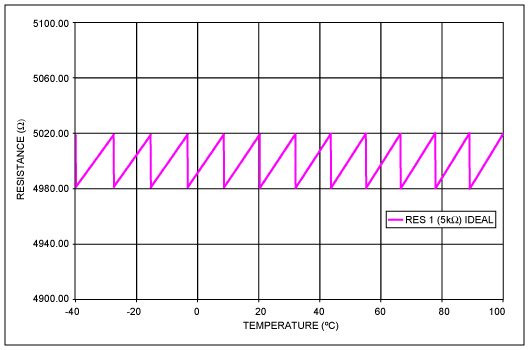
Figure 1. Ideal DS1847 Temperature Compensated 5kΩ Resistance.
Resistor 1's LUT was programmed with values corresponding to a nominal resistance value of 490Ω over temperature. Resistance data was then gathered over temperature, and the theoretical values from the calculations were plotted against the measured (actual) values
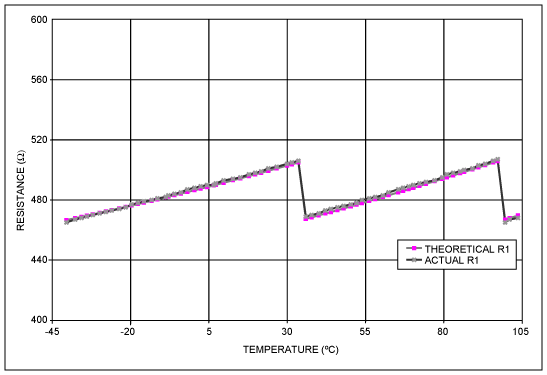
Figure 2. Resistor 1 Experimental Data vs. Ideal Performance
The results of the experiment indicate the equation very accurately calculates the value of the resistance for low-position settings. The accuracy in this particular case was always within ~2Ω of the expected value. Also note that even with compensation the resistance changes over temperature. It can only be compensated to within ?LSB best case, and thus the designer must allow for the some quantization error when designing the system.
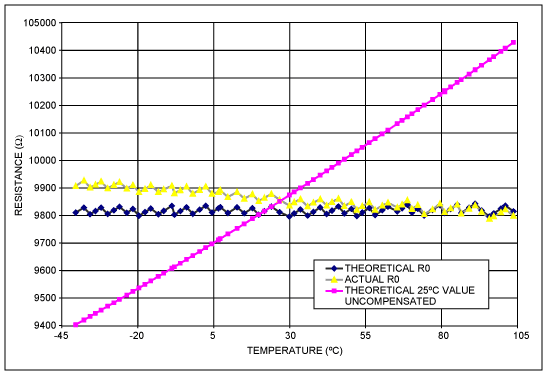
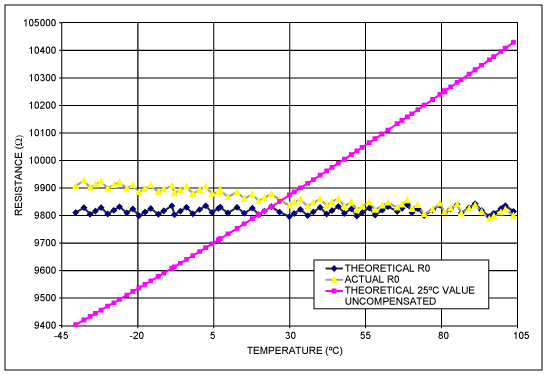
Figure 3. Resistor 0 Experimental Data vs. Ideal Performance
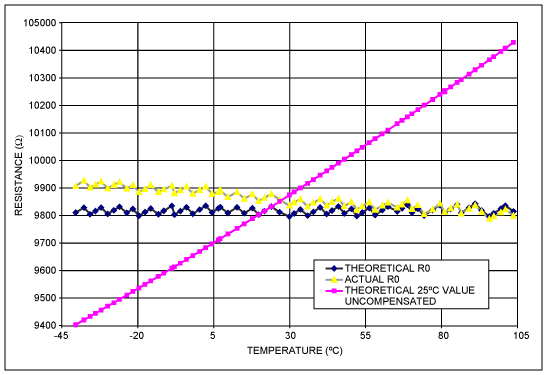
Resistor 0's LUT was loaded with values corresponding to approximately the maximum resistance that can be maintained over temperature. The maximum resistance for this part was approximately 9820Ω. The experiment was repeated, and the results were again plotted. This time an additional function was added that shows how the uncompensated room temperature resistance (a theoretical value, no lab data was acquired) would fair over temperature as well.
The results of this experiment show the full-scale resistance accuracy of the equation is approximately 2LSB from -40°C to room temperature (+25°C), and it is approximately 1LSB from room temperature to +100°C. A line fitted to the measured data shows that the resistor compensated itself fairly well over the entire range, with an effective TC of -85PPM/°C. When compared with the estimated +725PPM/°C of the uncompensated resistor, the benefit of the self-compensating DS1847 is obvious.
Introduction
The DS1847 and DS1848 are temperature-controlled digital resistors. These parts feature an EEPROM lookup table that allows a resistive function R(T) to be entered into memory, and then the parts are able to self-adjust their resistance as a function of the ambient temperature. The primary application of these parts is insertion into systems requiring calibration over temperature that can be accomplished with a variable resistance. The benefits of using them include the elimination of bulky mechanical potentiometers, IC reliability, automation of system calibration, and compensation of system temperature dependencies.Both the DS1847 and DS1848 feature two 256-position digital resistors and lookup tables (LUT) to automatically adjust the resistance over a temperature range of -40°C to +95°C. The DS1848 also features 128 bytes of user EEPROM for nonvolatile (NV) storage of other data. Up to eight chips can be accessed through a single 2-wire interface, which is used to communicate with the chips. Both parts are currently in production and available for purchase.
This application note explains the Temperature Coefficient (TC) of the DS1847 and, in particular, why the 850PPM/°C uncompensated TC does not apply to systems using the temperature lookup function. It also examines the accuracy of the LUT programming equation. This document is not intended to be a tutorial on how to use the DS1847 or DS1848, so please review the device datasheets before proceeding.
Uncompensated Temperature Coefficient Explained
The TC of a resistor can be defined several ways, so the definition of TC to be used with the DS1847 datasheet is provided by Equation 1.Equation 1.

- ΔR is the change in resistance as a function of temperature
- ΔT is the change in temperature expected or designed for
- TC is the temperature coefficient expressed with the units PPM/°C (see the TC vs. Resistance chart on the last page of the datasheet to obtain this value)
- RUNCOMP is the measured resistance of the part at a single (uncompensated) position before the temperature change occurs.
However, this is not the best description of TC for the DS1847. The TC is actually a function of the resistance itself. The chart on the last page of the datasheet plots the typical TC vs. resistance function. Notice that at low positions (low resistance), the TC is higher than at higher positions.
This TC function may initially cause concern, but here is a typical example to show the numbers associated with the TC vs. Resistance chart and Equation 1. The two conditions that will be looked at are a minimum resistance value and a maximum resistance value. In the case of a minimum resistance, about 500Ω for a DS1847-10, the temperature coefficient listed on the chart is 1450PPM. The resistance change caused by a 10°C temperature change can be calculated to be 7.3Ω. For the same temperature change, a 10kΩ resistor (680PPM/°C) will see a resistance change of 68Ω. The reason the higher resistance value has a greater change with temperature in spite of the lower TC is that the uncompensated resistance increased 20 fold, while the TC was reduced by approximately a factor of 2. Also realize that percentage change of the 10kΩ resistor ([68Ω*100%]/[10kΩ*10°C]) was lower 0.068%/°C versus the 0.145%/°C for the 500Ω resistor. This means that when the DS1847 is used to make small resistors it will have a lower temperature coefficient in terms of Ω/°C, and larger resistors have a lower temperature coefficient in terms of %/°C.
In the case of the 10kΩ resistor, the +68Ω resistance increase which occurred over a 10°C temperature change corresponds to a rate of +6.8Ω/°C. Thus, to stay at the 10kΩ target value the resistor's position should be decremented one position (~37Ω) every +5.6°C. Ideally, this would keep the resulting resistance within 1LSB of the target value. The 500Ω resistor works similarly, but it only requires compensation every 52°C because it has a lower temperature coefficient in terms of Ω/°C.
If the parts were ideal in the sense that every part has a minimum resistance of 500Ω and a maximum resistance of 10kΩ, the position could be calculated and compensated accurately using the method described above. Unfortunately, the process variation during the production of DS1847s and DS1848s adds another variable to complicate this even further. The maximum resistance of the DS1847/48 can change by as much as 20% from the nominal value of 10kΩ, and the TC is subject to some change over process as well. This makes it difficult to calculate the resistor position a system will require, because it is possible the process variation could cause the resistance corresponding to the ideal position to be off the targeted value by up to 20%.
To solve the problems associated with the process variation, six parameters are stored in each resistor's LUT to characterize them according to the equation provided in the Programming the Lookup Table section of the datasheet. The u, v, w, x, y, and z variables allow the user to accurately calculate what position they need to achieve a particular resistance at a particular temperature. If the entire table is programmed using the equation and these variables, the user should be within 2LSB of their desired resistance over the entire temperature range. This is why the 850PPM/°C is not necessarily relevant to the performance of the device in its normal mode of operation while using the equation. The LUT allows the resistance to be trimmed every 2°C, and a DS1847 will adjust itself to maintain the user's resistive function. The positions calculated using Equation 2 are already temperature compensating the DS1847 to within the accuracy of the equation.
Calculating The Positions For a DS1847
Ideally, the system designer would know what resistances are required as a function of temperature. The formula provided (Equation 2) can then be used to calculate which positions are required over the entire temperature range as a function of alpha (provided in the datasheet), the LUT variables (u, v...), the desired resistance, R, and the temperature, C. The calculated position will be a real number that must be rounded to the nearest integer. This will quantize the results to an LSB of the resistor, and consequently there will be some quantizing error. Equation 3 is Equation 2 resolved to calculate the resistance that should be expected based on the integer position stored in the LUT. The difference between the desired resistance and the resistance calculated with Equation 3 is the ideal quantizing error. This value should be within 1LSB of the target value.Equation 2.

Equation 3.

A spreadsheet is available on the Dallas Semiconductor ftp site that calculates the resistance of the part as a function of the u, v, w, x, y, and z variables, plus the alpha value from the datasheet.
Follow these instructions in order to use the spreadsheet:
- Read the unsigned binary numbers (u, v_) from the part for each resistor and convert them to decimal.
- Place the decimal numbers in the corresponding blue boxes in the spreadsheet.
- Place the correct alpha numbers for the type of part being used in the blue alpha box for each resistor.
- Type the desire resistance values for resistor 0 and 1 in the corresponding blue boxes.
- Press the calculate button.
Below is a chart showing an ideal temperature performance of the DS1847 when it is programmed to maintain a fixed resistor value over temperature. This chart is a theoretical performance, and it neglects that the DS1847 can only change its position every two degrees. This chart is provided to show how a DS1847 should compensate itself over temperature.

Figure 1. Ideal DS1847 Temperature Compensated 5kΩ Resistance.
Examining The Accuracy of the Datasheet LUT Programming Equation
For the purpose of this application note, one part was loaded with a set of data similar to the data shown in Figure 1, but resistor 0 was set at a maximum resistance, and resistor 1 was set at the minimum resistance that could be maintained over temperature. The intent of the experiment was to verify the accuracy of the LUT programming equation over temperature and to show an actual part temperature compensating itself.Resistor 1's LUT was programmed with values corresponding to a nominal resistance value of 490Ω over temperature. Resistance data was then gathered over temperature, and the theoretical values from the calculations were plotted against the measured (actual) values

Figure 2. Resistor 1 Experimental Data vs. Ideal Performance
The results of the experiment indicate the equation very accurately calculates the value of the resistance for low-position settings. The accuracy in this particular case was always within ~2Ω of the expected value. Also note that even with compensation the resistance changes over temperature. It can only be compensated to within ?LSB best case, and thus the designer must allow for the some quantization error when designing the system.

Figure 3. Resistor 0 Experimental Data vs. Ideal Performance
Resistor 0's LUT was loaded with values corresponding to approximately the maximum resistance that can be maintained over temperature. The maximum resistance for this part was approximately 9820Ω. The experiment was repeated, and the results were again plotted. This time an additional function was added that shows how the uncompensated room temperature resistance (a theoretical value, no lab data was acquired) would fair over temperature as well.
The results of this experiment show the full-scale resistance accuracy of the equation is approximately 2LSB from -40°C to room temperature (+25°C), and it is approximately 1LSB from room temperature to +100°C. A line fitted to the measured data shows that the resistor compensated itself fairly well over the entire range, with an effective TC of -85PPM/°C. When compared with the estimated +725PPM/°C of the uncompensated resistor, the benefit of the self-compensating DS1847 is obvious.
 電子發燒友App










評論