每天,都會創(chuàng)建 25 億 GB(千億字節(jié))的數(shù)據(jù),其中80-90% 的數(shù)據(jù)被歸類為“非結(jié)構(gòu)化”。本文著眼于圖形技術(shù)如何幫助數(shù)據(jù)分析行業(yè)解決這個日益嚴(yán)重的“數(shù)據(jù)泛濫”問題,以找到有效和可靠的見解。
谷歌、Facebook 和 LinkedIn 等科技巨頭長期以來一直利用圖形數(shù)據(jù)模型的力量來理解其數(shù)據(jù)中的模式和聯(lián)系。這些見解已被用于改進(jìn)網(wǎng)絡(luò)搜索并更好地了解用戶行為。
如今,圖形和圖形計算已在更多垂直行業(yè)中無處不在,并且它們被用于尋找新問題的創(chuàng)新解決方案。
一個例子是金融服務(wù)行業(yè),這是圖技術(shù)的一個巨大增長領(lǐng)域。分析公司 Gartner 預(yù)測,到 2022 年,銀行和投資公司將在技術(shù)產(chǎn)品和服務(wù)上花費 6230 億美元。例如,與前四個月相比,2021 年前四個月針對金融服務(wù)公司的數(shù)字欺詐攻擊增加了 149%,并已成為欺詐者最賺錢的騙局之一。為了解決這個問題,交互圖被用來深入了解客戶、賬戶和交易之間復(fù)雜的相互關(guān)系,從而改進(jìn)欺詐檢測。同樣,可以構(gòu)建和分析交互圖,通過尋找異常交易模式來防止洗錢。
另一個例子是制藥行業(yè)的藥物發(fā)現(xiàn)領(lǐng)域,鑒于全球 COVID-19 大流行,該領(lǐng)域受到了額外的關(guān)注。圖形技術(shù)可以分析關(guān)于藥物、治療、結(jié)果和患者的各種醫(yī)學(xué)知識數(shù)據(jù),并執(zhí)行“假設(shè)生成”以確定特定疾病的有希望的治療方法。同樣重要的是,這項技術(shù)也可用于排除提議的疾病治療方法。這使科學(xué)家能夠減少他們需要進(jìn)行的昂貴且耗時的濕實驗室實驗的數(shù)量,以發(fā)現(xiàn)疾病的治療方法。
除了加速藥物發(fā)現(xiàn)過程(平均花費超過 10 億美元,持續(xù)12 年或更長時間)之外,圖形技術(shù)也是新興精準(zhǔn)醫(yī)學(xué)領(lǐng)域不可或缺的一部分,擺脫了“一刀切”的局面” 藥物治療方法到定制治療方法,其中使用有關(guān)個體患者的數(shù)據(jù)來尋找針對該患者的治療方法。這使我們能夠建立一種更加個性化的醫(yī)療方法。
Graph 技術(shù)在某些行業(yè)還處于起步階段,因此其在金融欺詐、精準(zhǔn)醫(yī)療和信息安全等領(lǐng)域的應(yīng)用只是技術(shù)潛力的皮毛。該技術(shù)可應(yīng)用于太空探索、腫瘤學(xué)、甚至古語解密等邊緣領(lǐng)域!


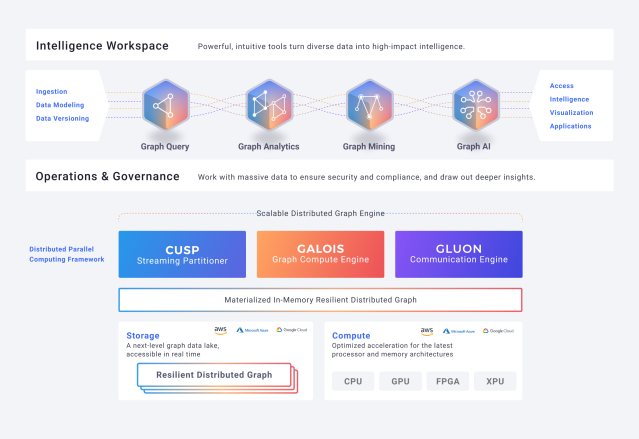
限制圖技術(shù)廣泛采用的障礙包括圖平臺在與第三方庫和數(shù)據(jù)處理管道中的其他系統(tǒng)進(jìn)行互操作時遇到的困難。這顯示了 Katana Graph 平臺的元素,這些元素可以解決這一挑戰(zhàn),以幫助從數(shù)據(jù)中提取情報。(圖片:武士刀圖表)。(點擊圖片展開)
In spite of graph computing’s ability to deliver data intelligence at speed and at scale, there are two obstacles that have limited its widespread adoption – a lack of understanding about its capabilities, and the difficulty that many graph platforms have had in interoperating with third-party libraries and other systems in data processing pipelines. These hurdles are now being addressed by graph vendors.
As the amount of data continues to increase – and as organizations continue to struggle with managing unstructured data – organizations must find new and innovative approaches to using this information to extract timely insights. Graph technology is one key part of the overall solution, and graph systems, in conjunction with other analytics technologies, will permit organizations to unlock deep insights from the enormous amount of data they already own.
This is the first of a two part-series. In the next article, Keshav Pingali will explain what best practices systems developers should follow to leverage graph technology.
審核編輯 黃昊宇
-
數(shù)據(jù)分析
+關(guān)注
關(guān)注
2文章
1452瀏覽量
34076
發(fā)布評論請先 登錄
相關(guān)推薦
Mathematica 在數(shù)據(jù)分析中的應(yīng)用
數(shù)據(jù)可視化與數(shù)據(jù)分析的關(guān)系
LLM在數(shù)據(jù)分析中的作用
eda與傳統(tǒng)數(shù)據(jù)分析的區(qū)別
為什么選擇eda進(jìn)行數(shù)據(jù)分析
raid 在大數(shù)據(jù)分析中的應(yīng)用
SUMIF函數(shù)在數(shù)據(jù)分析中的應(yīng)用
IP 地址大數(shù)據(jù)分析如何進(jìn)行網(wǎng)絡(luò)優(yōu)化?

數(shù)據(jù)分析除了spss還有什么
數(shù)據(jù)分析的工具有哪些
數(shù)據(jù)分析有哪些分析方法
機器學(xué)習(xí)在數(shù)據(jù)分析中的應(yīng)用
求助,關(guān)于AD采集到的數(shù)據(jù)分析問題
態(tài)勢數(shù)據(jù)分析系統(tǒng)軟件
BI數(shù)據(jù)分析軟件:行業(yè)趨勢與功能特點剖析


 圖形技術(shù)幫助數(shù)據(jù)分析行業(yè)解決數(shù)據(jù)泛濫問題


評論