

6、DBSCAN
DBSCAN 聚類(其中 DBSCAN 是基于密度的空間聚類的噪聲應(yīng)用程序)涉及在域中尋找高密度區(qū)域,并將其周圍的特征空間區(qū)域擴(kuò)展為群集。
…我們提出了新的聚類算法 DBSCAN 依賴于基于密度的概念的集群設(shè)計(jì),以發(fā)現(xiàn)任意形狀的集群。DBSCAN 只需要一個(gè)輸入?yún)?shù),并支持用戶為其確定適當(dāng)?shù)闹?/p>
-源自:《基于密度的噪聲大空間數(shù)據(jù)庫聚類發(fā)現(xiàn)算法》,1996
它是通過 DBSCAN 類實(shí)現(xiàn)的,主要配置是“ eps ”和“ min _ samples ”超參數(shù)。
下面列出了完整的示例。
# dbscan 聚類
from numpy import unique
from numpy import where
from sklearn.datasets import make_classification
from sklearn.cluster import DBSCAN
from matplotlib import pyplot
# 定義數(shù)據(jù)集
X, _ = make_classification(n_samples=1000,
n_features=2,
n_informative=2,
n_redundant=0,
n_clusters_per_class=1,
random_state=4)
# 定義模型
model = DBSCAN(eps=0.30, min_samples=9)
# 模型擬合與聚類預(yù)測
yhat = model.fit_predict(X)
# 檢索唯一群集
clusters = unique(yhat)
# 為每個(gè)群集的樣本創(chuàng)建散點(diǎn)圖
for cluster in clusters:
# 獲取此群集的示例的行索引
row_ix = where(yhat == cluster)
# 創(chuàng)建這些樣本的散布
pyplot.scatter(X[row_ix, 0], X[row_ix, 1])
# 繪制散點(diǎn)圖
pyplot.show()
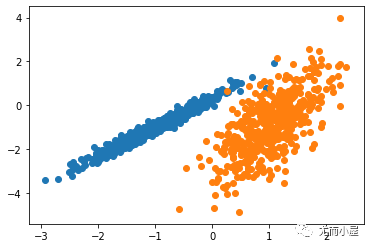
運(yùn)行該示例符合訓(xùn)練數(shù)據(jù)集上的模型,并預(yù)測數(shù)據(jù)集中每個(gè)示例的群集。然后創(chuàng)建一個(gè)散點(diǎn)圖,并由其指定的群集著色。在這種情況下,盡管需要更多的調(diào)整,但是找到了合理的分組。
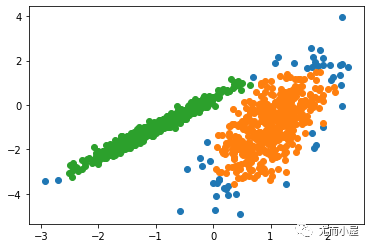
圖:使用DBSCAN集群識(shí)別出具有集群的數(shù)據(jù)集的散點(diǎn)圖
7、K均值
K-均值聚類可以是最常見的聚類算法,并涉及向群集分配示例,以盡量減少每個(gè)群集內(nèi)的方差。
本文的主要目的是描述一種基于樣本將 N 維種群劃分為 k 個(gè)集合的過程。這個(gè)叫做“ K-均值”的過程似乎給出了在類內(nèi)方差意義上相當(dāng)有效的分區(qū)。
-源自:《關(guān)于多元觀測的分類和分析的一些方法》1967年
它是通過 K-均值類實(shí)現(xiàn)的,要優(yōu)化的主要配置是“ n _ clusters ”超參數(shù)設(shè)置為數(shù)據(jù)中估計(jì)的群集數(shù)量。下面列出了完整的示例。
# k-means 聚類
from numpy import unique
from numpy import where
from sklearn.datasets import make_classification
from sklearn.cluster import KMeans
from matplotlib import pyplot
# 定義數(shù)據(jù)集
X, _ = make_classification(n_samples=1000,
n_features=2,
n_informative=2,
n_redundant=0,
n_clusters_per_class=1,
random_state=4)
# 定義模型
model = KMeans(n_clusters=2)
# 模型擬合
model.fit(X)
# 為每個(gè)示例分配一個(gè)集群
yhat = model.predict(X)
# 檢索唯一群集
clusters = unique(yhat)
# 為每個(gè)群集的樣本創(chuàng)建散點(diǎn)圖
for cluster in clusters:
# 獲取此群集的示例的行索引
row_ix = where(yhat == cluster)
# 創(chuàng)建這些樣本的散布
pyplot.scatter(X[row_ix, 0], X[row_ix, 1])
# 繪制散點(diǎn)圖
pyplot.show()
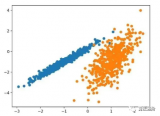
運(yùn)行該示例符合訓(xùn)練數(shù)據(jù)集上的模型,并預(yù)測數(shù)據(jù)集中每個(gè)示例的群集。然后創(chuàng)建一個(gè)散點(diǎn)圖,并由其指定的群集著色。在這種情況下,可以找到一個(gè)合理的分組,盡管每個(gè)維度中的不等等方差使得該方法不太適合該數(shù)據(jù)集。

圖:使用K均值聚類識(shí)別出具有聚類的數(shù)據(jù)集的散點(diǎn)圖
8、Mini-Batch K-均值
Mini-Batch K-均值是 K-均值的修改版本,它使用小批量的樣本而不是整個(gè)數(shù)據(jù)集對群集質(zhì)心進(jìn)行更新,這可以使大數(shù)據(jù)集的更新速度更快,并且可能對統(tǒng)計(jì)噪聲更健壯。
...我們建議使用 k-均值聚類的迷你批量優(yōu)化。與經(jīng)典批處理算法相比,這降低了計(jì)算成本的數(shù)量級,同時(shí)提供了比在線隨機(jī)梯度下降更好的解決方案。
—源自:《Web-Scale K-均值聚類》2010
它是通過 MiniBatchKMeans 類實(shí)現(xiàn)的,要優(yōu)化的主配置是“ n _ clusters ”超參數(shù),設(shè)置為數(shù)據(jù)中估計(jì)的群集數(shù)量。下面列出了完整的示例。
# mini-batch k均值聚類
from numpy import unique
from numpy import where
from sklearn.datasets import make_classification
from sklearn.cluster import MiniBatchKMeans
from matplotlib import pyplot
# 定義數(shù)據(jù)集
X, _ = make_classification(n_samples=1000,
n_features=2,
n_informative=2,
n_redundant=0,
n_clusters_per_class=1,
random_state=4)
# 定義模型
model = MiniBatchKMeans(n_clusters=2)
# 模型擬合
model.fit(X)
# 為每個(gè)示例分配一個(gè)集群
yhat = model.predict(X)
# 檢索唯一群集
clusters = unique(yhat)
# 為每個(gè)群集的樣本創(chuàng)建散點(diǎn)圖
for cluster in clusters:
# 獲取此群集的示例的行索引
row_ix = where(yhat == cluster)
# 創(chuàng)建這些樣本的散布
pyplot.scatter(X[row_ix, 0], X[row_ix, 1])
# 繪制散點(diǎn)圖
pyplot.show()
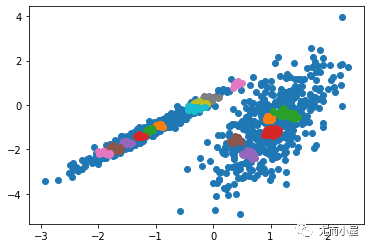
運(yùn)行該示例符合訓(xùn)練數(shù)據(jù)集上的模型,并預(yù)測數(shù)據(jù)集中每個(gè)示例的群集。然后創(chuàng)建一個(gè)散點(diǎn)圖,并由其指定的群集著色。在這種情況下,會(huì)找到與標(biāo)準(zhǔn) K-均值算法相當(dāng)?shù)慕Y(jié)果。

圖:帶有最小批次K均值聚類的聚類數(shù)據(jù)集的散點(diǎn)圖
9、均值漂移聚類
均值漂移聚類涉及到根據(jù)特征空間中的實(shí)例密度來尋找和調(diào)整質(zhì)心。
對離散數(shù)據(jù)證明了遞推平均移位程序收斂到最接近駐點(diǎn)的基礎(chǔ)密度函數(shù),從而證明了它在檢測密度模式中的應(yīng)用。
—源自:《Mean Shift :面向特征空間分析的穩(wěn)健方法》,2002
它是通過 MeanShift 類實(shí)現(xiàn)的,主要配置是“帶寬”超參數(shù)。下面列出了完整的示例。
# 均值漂移聚類
from numpy import unique
from numpy import where
from sklearn.datasets import make_classification
from sklearn.cluster import MeanShift
from matplotlib import pyplot
# 定義數(shù)據(jù)集
X, _ = make_classification(n_samples=1000,
n_features=2,
n_informative=2,
n_redundant=0,
n_clusters_per_class=1,
random_state=4)
# 定義模型
model = MeanShift()
# 模型擬合與聚類預(yù)測
yhat = model.fit_predict(X)
# 檢索唯一群集
clusters = unique(yhat)
# 為每個(gè)群集的樣本創(chuàng)建散點(diǎn)圖
for cluster in clusters:
# 獲取此群集的示例的行索引
row_ix = where(yhat == cluster)
# 創(chuàng)建這些樣本的散布
pyplot.scatter(X[row_ix, 0], X[row_ix, 1])
# 繪制散點(diǎn)圖
pyplot.show()
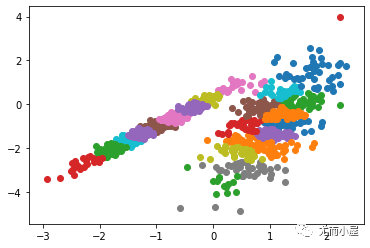
運(yùn)行該示例符合訓(xùn)練數(shù)據(jù)集上的模型,并預(yù)測數(shù)據(jù)集中每個(gè)示例的群集。然后創(chuàng)建一個(gè)散點(diǎn)圖,并由其指定的群集著色。在這種情況下,可以在數(shù)據(jù)中找到一組合理的群集。

圖:具有均值漂移聚類的聚類數(shù)據(jù)集散點(diǎn)圖
-
代碼
+關(guān)注
關(guān)注
30文章
4886瀏覽量
70253 -
數(shù)據(jù)分析
+關(guān)注
關(guān)注
2文章
1470瀏覽量
34796 -
python
+關(guān)注
關(guān)注
56文章
4825瀏覽量
86175
發(fā)布評論請先 登錄
一種基于聚類和競爭克隆機(jī)制的多智能體免疫算法
一種改進(jìn)的BIRCH算法聚類方法

Python無監(jiān)督學(xué)習(xí)的幾種聚類算法包括K-Means聚類,分層聚類等詳細(xì)概述
如何在python中安裝和使用頂級聚類算法?
一種自適應(yīng)的關(guān)聯(lián)融合聚類算法


 工商網(wǎng)監(jiān)

評論