


Profile模型訓練的循環
標記任意代碼范圍
Profile 內存消耗
總覽
Flops 測量
多GPU,多節點,數據并行和模型并行
例子
和DeepSpeed運行時一起使用
在Megatron-LM中使用
在 DeepSpeed 運行環境之外的使用方法
訓練工作流例子
0x0. 前言
這篇翻譯是對 https://www.deepspeed.ai/tutorials/pytorch-profiler/ 和 https://www.deepspeed.ai/tutorials/flops-profiler/ 兩篇教程做的,使用DeepSpeed訓練模型可以基于這兩個教程做一下Profile工作判斷模型的計算以及內存瓶頸在哪個地方。
0x1. 在 DeepSpeed 中使用 PyTorch Profiler做性能調試
對應原始的教程:https://www.deepspeed.ai/tutorials/pytorch-profiler/
這個教程描述的是如何在DeepSpeed中使用PyTorch Profiler工具(https://pytorch.org/blog/introducing-pytorch-profiler-the-new-and-improved-performance-tool/)。
PyTorch Profiler 是一個開源工具,能夠為大規模深度學習模型提供精確且高效的性能分析和故障排查。分析結果可以輸出為 .json 追蹤文件,并在 Google Chrome 的追蹤查看器 (chrome://tracing) 中查看。Microsoft Visual Studio Code 的 Python 擴展將 TensorBoard 集成到代碼編輯器中,包括對 PyTorch Profiler 的支持。更多的細節可以參考(https://pytorch.org/tutorials/recipes/recipes/profiler_recipe.html#pytorch-profiler)
Profile模型訓練的循環
下面展示了如何通過在 Profiler 上下文管理器中封裝代碼來分析訓練循環。Profiler 假設訓練過程由steps(從零開始編號)組成。PyTorch Profiler 接受許多參數,例如 schedule, on_trace_ready, with_stack 等。
在下面的例子中,分析器將跳過前5步,使用接下來的2步作為預熱,并記錄接下來的6步。由于repeat設為2,所以分析器將在兩個周期后停止記錄(這里的周期的意思是將active的step數重復repeat次)。關于 schedule 的詳細使用方法,請參考使用Profiler分析長時間運行的任務(https://pytorch.org/tutorials/recipes/recipes/profiler_recipe.html#using-profiler-to-analyze-long-running-jobs)。
fromtorch.profilerimportprofile,record_function,ProfilerActivity

withtorch.profiler.profile(
schedule=torch.profiler.schedule(
wait=5,#Duringthisphaseprofilerisnotactive.
warmup=2,#Duringthisphaseprofilerstartstracing,buttheresultsarediscarded.
active=6,#Duringthisphaseprofilertracesandrecordsdata.
repeat=2),#Specifiesanupperboundonthenumberofcycles.
on_trace_ready=tensorboard_trace_handler,
with_stack=True#Enablestacktracing,addsextraprofilingoverhead.
)asprofiler:
forstep,batchinenumerate(data_loader):
print("step:{}".format(step))

#forward()method
loss=model_engine(batch)

#runsbackpropagation
model_engine.backward(loss)

#weightupdate
model_engine.step()
profiler.step()#Sendthesignaltotheprofilerthatthenextstephasstarted.
標記任意代碼范圍
可以使用 record_function 上下文管理器標記任意用戶指定的代碼范圍。例如,以下代碼將 "model_forward" 標記為一個label:
withprofile(record_shapes=True)asprof:#record_shapesindicateswhethertorecordshapesoftheoperatorinputs.
withrecord_function("model_forward"):"
model_engine(inputs)
后續在profile結果里面就可以看到標記的這個"model_forward"的耗時情況了。
Profile CPU/GPU的活動
傳遞給 Profiler 的 activities 參數指定了在使用 profiler 上下文管理器包裝的代碼范圍執行期間要進行性能分析的活動列表:
ProfilerActivity.CPU - PyTorch 操作符、TorchScript 函數和用戶定義的代碼標簽(record_function)。
ProfilerActivity.CUDA - 在設備上的 CUDA 核函數。請注意,CUDA 性能分析會帶來不可忽視的開銷。下面的例子在模型的前向傳播中對 CPU 和 GPU 的活動進行了性能分析,并按總 CUDA 時間排序打印了總結表。
withprofile(activities=[
ProfilerActivity.CPU,ProfilerActivity.CUDA],record_shapes=True)asprof:
withrecord_function("model_forward"):
model_engine(inputs)

print(prof.key_averages().table(sort_by="cuda_time_total",row_limit=10))
Profile 內存消耗
通過向 PyTorch Profiler傳遞 profile_memory=True,我們啟用了內存分析功能,該功能記錄在模型OP的執行過程中分配(或釋放)的模型張量所使用的內存量。例如:
withprofile(activities=[ProfilerActivity.CUDA],
profile_memory=True,record_shapes=True)asprof:
model(inputs)

print(prof.key_averages().table(sort_by="self_cuda_memory_usage",row_limit=10))
0x2. Flops Profiler
對應原始的教程:https://www.deepspeed.ai/tutorials/flops-profiler/
在這個教程中,我們將介紹 DeepSpeed Flops Profiler,并提供其使用的示例。
總覽
有效利用硬件資源對于良好的性能至關重要,但在現有的大規模模型訓練和推理實現中,性能低效往往難以察覺并歸因于特定的模塊組件。DeepSpeed Flops Profiler幫助用戶輕松測量模型及其子模塊的訓練/推理速度(延遲,吞吐量)和效率(每秒浮點運算次數,即FLOPS),旨在消除現有實現中的效率低下問題。
以下是在A100 GPU上,批量大小為80的BERT-Large(NVIDIA)的示例輸出:
-------------------------- DeepSpeed Flops Profiler --------------------------
Profile Summary at step 10:
Notations:
data parallel size (dp_size), model parallel size(mp_size),
number of parameters (params), number of multiply-accumulate operations(MACs),
number of floating-point operations (flops), floating-point operations per second (FLOPS),
fwd latency (forward propagation latency), bwd latency (backward propagation latency),
step (weights update latency), iter latency (sum of fwd, bwd and step latency)

world size:                                                   1
data parallel size:                                           1
model parallel size:                                          1
batch size per GPU:                                           80
params per gpu:                                               336.23 M
params of model = params per GPU * mp_size:                   336.23 M
fwd MACs per GPU:                                             3139.93 G
fwd flops per GPU:                                            6279.86 G
fwd flops of model = fwd flops per GPU * mp_size:             6279.86 G
fwd latency:                                                  76.67 ms
bwd latency:                                                  108.02 ms
fwd FLOPS per GPU = fwd flops per GPU / fwd latency:          81.9 TFLOPS
bwd FLOPS per GPU = 2 * fwd flops per GPU / bwd latency:      116.27 TFLOPS
fwd+bwd FLOPS per GPU = 3 * fwd flops per GPU / (fwd+bwd latency):   102.0 TFLOPS
step latency:                                                 34.09 us
iter latency:                                                 184.73 ms
samples/second:                                               433.07

----------------------------- Aggregated Profile per GPU -----------------------------
Top modules in terms of params, MACs or fwd latency at different model depths:
depth 0:
    params      - {'BertForPreTrainingPreLN': '336.23 M'}
    MACs        - {'BertForPreTrainingPreLN': '3139.93 GMACs'}
    fwd latency - {'BertForPreTrainingPreLN': '76.39 ms'}
depth 1:
    params      - {'BertModel': '335.15 M', 'BertPreTrainingHeads': '32.34 M'}
    MACs        - {'BertModel': '3092.96 GMACs', 'BertPreTrainingHeads': '46.97 GMACs'}
    fwd latency - {'BertModel': '34.29 ms', 'BertPreTrainingHeads': '3.23 ms'}
depth 2:
    params      - {'BertEncoder': '302.31 M', 'BertLMPredictionHead': '32.34 M'}
    MACs        - {'BertEncoder': '3092.88 GMACs', 'BertLMPredictionHead': '46.97 GMACs'}
    fwd latency - {'BertEncoder': '33.45 ms', 'BertLMPredictionHead': '2.61 ms'}
depth 3:
    params      - {'ModuleList': '302.31 M', 'Embedding': '31.79 M', 'Linear': '31.26 M'}
    MACs        - {'ModuleList': '3092.88 GMACs', 'Linear': '36.23 GMACs'}
    fwd latency - {'ModuleList': '33.11 ms', 'BertPredictionHeadTransform': '1.83 ms''}
depth 4:
    params      - {'BertLayer': '302.31 M', 'LinearActivation': '1.05 M''}
    MACs        - {'BertLayer': '3092.88 GMACs', 'LinearActivation': '10.74 GMACs'}
    fwd latency - {'BertLayer': '33.11 ms', 'LinearActivation': '1.43 ms'}
depth 5:
    params      - {'BertAttention': '100.76 M', 'BertIntermediate': '100.76 M'}
    MACs        - {'BertAttention': '1031.3 GMACs', 'BertIntermediate': '1030.79 GMACs'}
    fwd latency - {'BertAttention': '19.83 ms', 'BertOutput': '4.38 ms'}
depth 6:
    params      - {'LinearActivation': '100.76 M', 'Linear': '100.69 M'}
    MACs        - {'LinearActivation': '1030.79 GMACs', 'Linear': '1030.79 GMACs'}
    fwd latency - {'BertSelfAttention': '16.29 ms', 'LinearActivation': '3.48 ms'}

------------------------------ Detailed Profile per GPU ------------------------------
Each module profile is listed after its name in the following order:
params, percentage of total params, MACs, percentage of total MACs, fwd latency, percentage of total fwd latency, fwd FLOPS

BertForPreTrainingPreLN(
  336.23 M, 100.00% Params, 3139.93 GMACs, 100.00% MACs, 76.39 ms, 100.00% latency, 82.21 TFLOPS,
  (bert): BertModel(
    335.15 M, 99.68% Params, 3092.96 GMACs, 98.50% MACs, 34.29 ms, 44.89% latency, 180.4 TFLOPS,
    (embeddings): BertEmbeddings(...)
    (encoder): BertEncoder(
      302.31 M, 89.91% Params, 3092.88 GMACs, 98.50% MACs, 33.45 ms, 43.79% latency, 184.93 TFLOPS,
      (FinalLayerNorm): FusedLayerNorm(...)
      (layer): ModuleList(
        302.31 M, 89.91% Params, 3092.88 GMACs, 98.50% MACs, 33.11 ms, 43.35% latency, 186.8 TFLOPS,
        (0): BertLayer(
          12.6 M, 3.75% Params, 128.87 GMACs, 4.10% MACs, 1.29 ms, 1.69% latency, 199.49 TFLOPS,
          (attention): BertAttention(
            4.2 M, 1.25% Params, 42.97 GMACs, 1.37% MACs, 833.75 us, 1.09% latency, 103.08 TFLOPS,
            (self): BertSelfAttention(
              3.15 M, 0.94% Params, 32.23 GMACs, 1.03% MACs, 699.04 us, 0.92% latency, 92.22 TFLOPS,
              (query): Linear(1.05 M, 0.31% Params, 10.74 GMACs, 0.34% MACs, 182.39 us, 0.24% latency, 117.74 TFLOPS,...)
              (key): Linear(1.05 M, 0.31% Params, 10.74 GMACs, 0.34% MACs, 57.22 us, 0.07% latency, 375.3 TFLOPS,...)
              (value): Linear(1.05 M, 0.31% Params, 10.74 GMACs, 0.34% MACs, 53.17 us, 0.07% latency, 403.91 TFLOPS,...)
              (dropout): Dropout(...)
              (softmax): Softmax(...)
            )
            (output): BertSelfOutput(
              1.05 M, 0.31% Params, 10.74 GMACs, 0.34% MACs, 114.68 us, 0.15% latency, 187.26 TFLOPS,
              (dense): Linear(1.05 M, 0.31% Params, 10.74 GMACs, 0.34% MACs, 64.13 us, 0.08% latency, 334.84 TFLOPS, ...)
              (dropout): Dropout(...)
            )
          )
          (PreAttentionLayerNorm): FusedLayerNorm(...)
          (PostAttentionLayerNorm): FusedLayerNorm(...)
          (intermediate): BertIntermediate(
            4.2 M, 1.25% Params, 42.95 GMACs, 1.37% MACs, 186.68 us, 0.24% latency, 460.14 TFLOPS,
            (dense_act): LinearActivation(4.2 M, 1.25% Params, 42.95 GMACs, 1.37% MACs, 175.0 us, 0.23% latency, 490.86 TFLOPS,...)
          )
          (output): BertOutput(
            4.2 M, 1.25% Params, 42.95 GMACs, 1.37% MACs, 116.83 us, 0.15% latency, 735.28 TFLOPS,
            (dense): Linear(4.2 M, 1.25% Params, 42.95 GMACs, 1.37% MACs, 65.57 us, 0.09% latency, 1310.14 TFLOPS,...)
            (dropout): Dropout(...)
          )
        )
        ...
        (23): BertLayer(...)
      )
    )
    (pooler): BertPooler(...)
  )
  (cls): BertPreTrainingHeads(...)
)
------------------------------------------------------------------------------
在 profile 總結中,DeepSpeed Flops Profiler輸出了模型的參數量,浮點運算數(flops),FLOPS,延遲,以及樣本/秒的吞吐量。此概況顯示了當前模型執行與硬件峰值性能之間的性能差距,并幫助用戶調整訓練或推理設置(例如,超參數,數據并行性,模型并行性,系統配置等)以獲得更好的性能。
DeepSpeed Flops Profiler還可以在不同的模型深度(聚合profile)和模型架構中的特定模塊(詳細profile)Profile重要模塊。通過這些Profile,DeepSpeed用戶可以理解每個層或子模塊對整個模型復雜性/性能的貢獻。然后,用戶可以調整或重構模型設計以提高性能。例如,使用Profiler,DeepSpeed用戶可以量化地判斷堆疊較小的層是否比擁有較大的層更輕量或性能更好。聚合和詳細 Profile 還允許用戶快速識別瓶頸模塊。在上面的BERT-Large示例中,使用DeepSpeed Flops Profiler,我們發現BertLayer是最重要的層,并且包含了很多dropout,softmax和layer norm以及線性層模塊。這些模塊在flops中并不heavy,但會觸發許多GPU Kernel調用并創建過多的內存讀/寫請求。詳細Profile中顯示的Pattern表明這是Kernel融合的完美匹配,我們開發了fused transformer-kernels來減少數據移動(參見 https://www.deepspeed.ai/tutorials/bert-pretraining/)。在應用我們的優化之后,我們在DeepSpeed Flops Profiler的輸出中看到每GPU的FLOPS和總體訓練樣本/秒提高了25%。
DeepSpeed Flops Profiler可以與DeepSpeed運行時一起使用,并無需任何用戶代碼更改,也可以獨立于DeepSpeed作為一個獨立的包使用。在使用DeepSpeed進行模型訓練時,可以在DeepSpeed配置文件(https://www.deepspeed.ai/docs/config-json/#flops-profiler)中啟用分析器。作為一個獨立的包,分析器API可以在訓練和推理代碼中使用。DeepSpeed分析器仍在積極開發中,目前僅包含初始功能。請保持關注,很快會添加更多激動人心的功能。
Flops 測量
與現有的flops計算工具或方法類似,DeepSpeed Flops分析器測量Module前向傳播的flops,而反向傳播的flops則被估計為前向傳播flops的兩倍。與計算PyTorch Op的flops的PyTorch分析器不同,DeepSpeed Flops分析器測量模型中模塊內部的flops,并為用戶提供關于模型執行的更多洞察。flops估計部分受到ptflops(https://github.com/sovrasov/flops-counter.pytorch)的啟發,主要區別在于,DeepSpeed Flops分析器不僅支持直接在模塊級別進行FLOPS計算,還可以捕獲在模塊中調用的torch.nn.functional來估計flops。因此,DeepSpeed Flops分析器允許在模型中使用自定義模塊,例如Megatron-LM中的ParallelTransformerLayerworks、ParallelSelfAttention、RowParallelLinear等。這與ptflops形成對比,ptflops要求用戶為每個自定義模塊編寫自定義的flops計算函數。
多GPU,多節點,數據并行和模型并行
DeepSpeed Flops 分析器輸出每個 GPU 的分析結果以及world size,數據并行大小和模型并行大小。
對于在多 GPU 或多節點上運行的模型,只有模型并行(例如,Megatron-LM 中的 --model-parallel-size)的改變會影響浮點操作數和Paramater的分析結果,即,model_parallel_size * flops = total_flops 和 model_parallel_size * parameters = total_parameters。數據并行大小或world size(與 GPU 或節點的數量相關)不會影響每個 GPU 的分析結果。
例子
DeepSpeed Flops 分析器可以與 DeepSpeed 運行時一起使用,也可以作為一個獨立的包使用。當使用 DeepSpeed 進行模型訓練時,用戶無需更改代碼,就可以在 deepspeed 配置文件(https://www.deepspeed.ai/docs/config-json/#flops-profiler)中配置分析器。要在 DeepSpeed 運行時之外使用 flops 分析器,安裝 DeepSpeed 并導入 flops_profiler 包直接使用 API。下面給出了每種使用方法的示例。
和DeepSpeed運行時一起使用
當使用 DeepSpeed 進行模型訓練時,可以在 deepspeed 配置文件中配置分析器。使用分析器不需要明確的 API 調用。可以通過在 deepspeed 的配置 json 文件中添加以下字段來啟用分析器。具體詳情請參考 flops profiler(https://www.deepspeed.ai/docs/config-json/#flops-profiler)。
{
"flops_profiler":{
"enabled":true,
"profile_step":1,
"module_depth":-1,
"top_modules":1,
"detailed":true,
"output_file":null
}
}
在Megatron-LM中使用
關于使用 DeepSpeed 運行 Megatron-LM 的信息,請參考我們的教程 Megatron-LM。
下面展示了一個 12 層 Megatron-LM 模型的示例輸出(hidden_size = 8192,num_attention_heads = 32,batch_size = 1024,seq_length = 1024)。
-------------------------- DeepSpeed Flops Profiler --------------------------
Profile Summary at step 10:
Notations:
data parallel size (dp_size), model parallel size(mp_size),
number of parameters (params), number of multiply-accumulate operations(MACs),
number of floating-point operations (flops), floating-point operations per second (FLOPS),
fwd latency (forward propagation latency), bwd latency (backward propagation latency),
step (weights update latency), iter latency (sum of fwd, bwd and step latency)

world size:                                                   1
data parallel size:                                           1
model parallel size:                                          1
batch size per GPU:                                           1024
params per gpu:                                               1.29 M
params of model = params per GPU * mp_size:                   1.29 M
fwd MACs per GPU:                                             41271.95 G
fwd flops per GPU:                                            82543.9 G
fwd flops of model = fwd flops per GPU * mp_size:             82543.9 G
fwd latency:                                                  1.89 s
bwd latency:                                                  5.38 s
fwd FLOPS per GPU = fwd flops per GPU / fwd latency:          43.68 TFLOPS
bwd FLOPS per GPU = 2 * fwd flops per GPU / bwd latency:      30.7 TFLOPS
fwd+bwd FLOPS per GPU = 3 * fwd flops per GPU / (fwd+bwd latency):   34.07 TFLOPS
step latency:                                                 34.12 s
iter latency:                                                 41.39 s
samples/second:                                               24.74

----------------------------- Aggregated Profile per GPU -----------------------------
Top 1 modules in terms of params, MACs or fwd latency at different model depths:
depth 0:
    params      - {'GPT2Model': '1.29 M'}
    MACs        - {'GPT2Model': '41271.95 GMACs'}
    fwd latency - {'GPT2Model': '1.84 s'}
depth 1:
    params      - {'TransformerLanguageModel': '1.29 M'}
    MACs        - {'TransformerLanguageModel': '39584.03 GMACs'}
    fwd latency - {'TransformerLanguageModel': '1.83 s'}
depth 2:
    params      - {'ParallelTransformer': '1.29 M'}
    MACs        - {'ParallelTransformer': '39584.03 GMACs'}
    fwd latency - {'ParallelTransformer': '1.81 s'}
depth 3:
    params      - {'ModuleList': '1.28 M'}
    MACs        - {'ModuleList': '39584.03 GMACs'}
    fwd latency - {'ModuleList': '1.3 s'}
depth 4:
    params      - {'ParallelTransformerLayerPart2': '688.15 k'}
    MACs        - {'ParallelTransformerLayerPart2': '26388.28 GMACs'}
    fwd latency - {'ParallelTransformerLayerPart2': '865.73 ms'}
depth 5:
    params      - {'ParallelMLP': '491.54 k'}
    MACs        - {'ParallelMLP': '26388.28 GMACs'}
    fwd latency - {'ParallelMLP': '849.4 ms'}

------------------------------ Detailed Profile per GPU ------------------------------
Each module profile is listed after its name in the following order:
params, percentage of total params, MACs, percentage of total MACs, fwd latency, percentage of total fwd latency, fwd FLOPS

Note: 1. A module can have torch.nn.module or torch.nn.functional to compute logits (e.g. CrossEntropyLoss). They are not counted as submodules, thus not to be printed out. However they make up the difference between a parent's MACs(or latency) and the sum of its submodules'.
1. Number of floating-point operations is a theoretical estimation, thus FLOPS computed using that could be larger than the maximum system throughput.
2. The fwd latency listed in the top module's profile is directly captured at the module forward function in PyTorch, thus it's less than the fwd latency shown above which is captured in DeepSpeed.

GPT2Model(
  1.29 M, 100.00% Params, 41271.95 GMACs, 100.00% MACs, 1.84 s, 100.00% latency, 44.78 TFLOPS,
  (language_model): TransformerLanguageModel(
    1.29 M, 100.00% Params, 39584.03 GMACs, 95.91% MACs, 1.83 s, 99.11% latency, 43.34 TFLOPS,
    (embedding): Embedding(
      2, 0.00% Params, 0 MACs, 0.00% MACs, 18.1 ms, 0.98% latency, 0.0 FLOPS,
      (word_embeddings): VocabParallelEmbedding(1, 0.00% Params, 0 MACs, 0.00% MACs, 164.75 us, 0.01% latency, 0.0 FLOPS, )
      (position_embeddings): Embedding(1, 0.00% Params, 0 MACs, 0.00% MACs, 489.23 us, 0.03% latency, 0.0 FLOPS, 1024, 8192)
      (embedding_dropout): Dropout(0, 0.00% Params, 0 MACs, 0.00% MACs, 93.94 us, 0.01% latency, 0.0 FLOPS, p=0.1, inplace=False)
    )
    (transformer): ParallelTransformer(
      1.29 M, 100.00% Params, 39584.03 GMACs, 95.91% MACs, 1.81 s, 98.11% latency, 43.78 TFLOPS,
      (layers): ModuleList(
        1.28 M, 98.73% Params, 39584.03 GMACs, 95.91% MACs, 1.3 s, 70.66% latency, 60.79 TFLOPS,
        (0): ParallelTransformerLayerPart1(
          49.15 k, 3.80% Params, 1099.65 GMACs, 2.66% MACs, 23.5 ms, 1.27% latency, 93.6 TFLOPS,
          (input_layernorm): FusedLayerNorm(16.38 k, 1.27% Params, 0 MACs, 0.00% MACs, 128.75 us, 0.01% latency, 0.0 FLOPS, torch.Size([8192]), eps=1e-05, elementwise_affine=True)
          (attention): ParallelSelfAttention(
            32.77 k, 2.53% Params, 1099.65 GMACs, 2.66% MACs, 22.8 ms, 1.24% latency, 96.46 TFLOPS,
            (query_key_value): ColumnParallelLinear(24.58 k, 1.90% Params, 824.63 GMACs, 2.00% MACs, 8.93 ms, 0.48% latency, 184.7 TFLOPS, )
            (scale_mask_softmax): FusedScaleMaskSoftmax(0, 0.00% Params, 134.22 MMACs, 0.00% MACs, 151.16 us, 0.01% latency, 1.78 TFLOPS, )
            (attention_dropout): Dropout(0, 0.00% Params, 0 MACs, 0.00% MACs, 79.63 us, 0.00% latency, 0.0 FLOPS, p=0.1, inplace=False)
            (dense): RowParallelLinear(8.19 k, 0.63% Params, 274.88 GMACs, 0.67% MACs, 2.67 ms, 0.14% latency, 205.81 TFLOPS, )
          )
        )
        (1): ParallelTransformerLayerPart2(
          57.35 k, 4.43% Params, 2199.02 GMACs, 5.33% MACs, 77.53 ms, 4.21% latency, 56.73 TFLOPS,
          (post_attention_layernorm): FusedLayerNorm(16.38 k, 1.27% Params, 0 MACs, 0.00% MACs, 116.11 us, 0.01% latency, 0.0 FLOPS, torch.Size([8192]), eps=1e-05, elementwise_affine=True)
          (mlp): ParallelMLP(
            40.96 k, 3.16% Params, 2199.02 GMACs, 5.33% MACs, 76.19 ms, 4.13% latency, 57.72 TFLOPS,
            (dense_h_to_4h): ColumnParallelLinear(32.77 k, 2.53% Params, 1099.51 GMACs, 2.66% MACs, 10.79 ms, 0.59% latency, 203.81 TFLOPS, )
            (dense_4h_to_h): RowParallelLinear(8.19 k, 0.63% Params, 1099.51 GMACs, 2.66% MACs, 14.38 ms, 0.78% latency, 152.95 TFLOPS, )
          )
        )
        ...
        (23): ParallelTransformerLayerPart2(...)
      )
      (final_layernorm): FusedLayerNorm(16.38 k, 1.27% Params, 0 MACs, 0.00% MACs, 110.86 us, 0.01% latency, 0.0 FLOPS, torch.Size([8192]), eps=1e-05, elementwise_affine=True)
    )
  )
)
------------------------------------------------------------------------------
可以參考最新的DeepSpeed-Megatron倉庫,然后在訓練模型時將DeepSpeed的config文件配置DeepSpeed Profiler。
在 DeepSpeed 運行環境之外的使用方法
profiler 可以在 DeepSpeed 運行時環境之外作為一個獨立的包來使用。你只需要簡單地安裝 DeepSpeed 并導入 flops_profiler 包來直接使用 API。關于如何安裝 DeepSpeed,請參考 DeepSpeed 的安裝指南。
在模型推理中
要對推理狀態的訓練模型進行性能分析,請使用 get_model_profile 函數。下面給出了一些示例。
AlexNet例子
以下示例展示了如何使用 DeepSpeed flops 分析器對 AlexNet 進行性能分析。
import torchvision.models as models
import torch
from deepspeed.profiling.flops_profiler import get_model_profile
from deepspeed.accelerator import get_accelerator

with get_accelerator().device(0):
    model = models.alexnet()
    batch_size = 256
    flops, macs, params = get_model_profile(model=model, # model
                                    input_shape=(batch_size, 3, 224, 224), # input shape to the model. If specified, the model takes a tensor with this shape as the only positional argument.
                                    args=None, # list of positional arguments to the model.
                                    kwargs=None, # dictionary of keyword arguments to the model.
                                    print_profile=True, # prints the model graph with the measured profile attached to each module
                                    detailed=True, # print the detailed profile
                                    module_depth=-1, # depth into the nested modules, with -1 being the inner most modules
                                    top_modules=1, # the number of top modules to print aggregated profile
                                    warm_up=10, # the number of warm-ups before measuring the time of each module
                                    as_string=True, # print raw numbers (e.g. 1000) or as human-readable strings (e.g. 1k)
                                    output_file=None, # path to the output file. If None, the profiler prints to stdout.
                                    ignore_modules=None) # the list of modules to ignore in the profiling
BERT例子
from functools import partial
import torch
from transformers import BertForSequenceClassification, BertTokenizer
from deepspeed.profiling.flops_profiler import get_model_profile
from deepspeed.accelerator import get_accelerator


def bert_input_constructor(batch_size, seq_len, tokenizer):
    fake_seq = ""
    for _ in range(seq_len - 2):  # ignore the two special tokens [CLS] and [SEP]
      fake_seq += tokenizer.pad_token
    inputs = tokenizer([fake_seq] * batch_size,
                       padding=True,
                       truncation=True,
                       return_tensors="pt")
    labels = torch.tensor([1] * batch_size)
    inputs = dict(inputs)
    inputs.update({"labels": labels})
    return inputs


with get_accelerator().device(0):
    tokenizer = BertTokenizer.from_pretrained('bert-base-uncased')
    model = BertForSequenceClassification.from_pretrained('bert-base-uncased')
    batch_size = 4
    seq_len = 128
    enable_profile = True
    if enable_profile:
      flops, macs, params = get_model_profile(
          model,
          kwargs=bert_input_constructor(batch_size, seq_len, tokenizer),
          print_profile=True,
          detailed=True,
      )
    else:
      inputs = bert_input_constructor((batch_size, seq_len), tokenizer)
      outputs = model(inputs)
在模型訓練工作流中
要在訓練工作流中對模型的前向過程進行性能分析,請使用 FlopsProfiler 類。FlopsProfiler 類提供了以下方法:
start_profile() - 開始profiling。
get_total_flops(as_string=False)- 返回模型中的浮點操作的總數。
get_total_macs(as_string=False- 返回模型中的macs的總數。
get_total_params(as_string=False)- 返回模型中參數的總數。
print_model_profile(profile_step=1, module_depth=-1, top_modules=3, detailed=True, output_file=None)-打印模型profile。
stop_profile()-停止性能分析。這將停止模型中的浮點運算計數。
end_profile()-進行清理。這將清理在性能分析過程中添加到模型的性能分析屬性。這應該在性能分析結束并且在調用get_total_flops、get_total_params或print_model_profile之后進行。
訓練工作流例子
以下是一個典型的訓練工作流中使用該方法的示例。
from deepspeed.profiling.flops_profiler import FlopsProfiler

model = Model()
prof = FlopsProfiler(model)

profile_step = 5
print_profile= True

for step, batch in enumerate(data_loader):
  # start profiling at training step "profile_step"
  if step == profile_step:
    prof.start_profile()

  # forward() method
  loss = model(batch)

  # end profiling and print output
  if step == profile_step: # if using multi nodes, check global_rank == 0 as well
    prof.stop_profile()
    flops = prof.get_total_flops()
    macs = prof.get_total_macs()
    params = prof.get_total_params()
    if print_profile:
        prof.print_model_profile(profile_step=profile_step)
    prof.end_profile()

  # runs backpropagation
  loss.backward()

  # weight update
  optimizer.step()
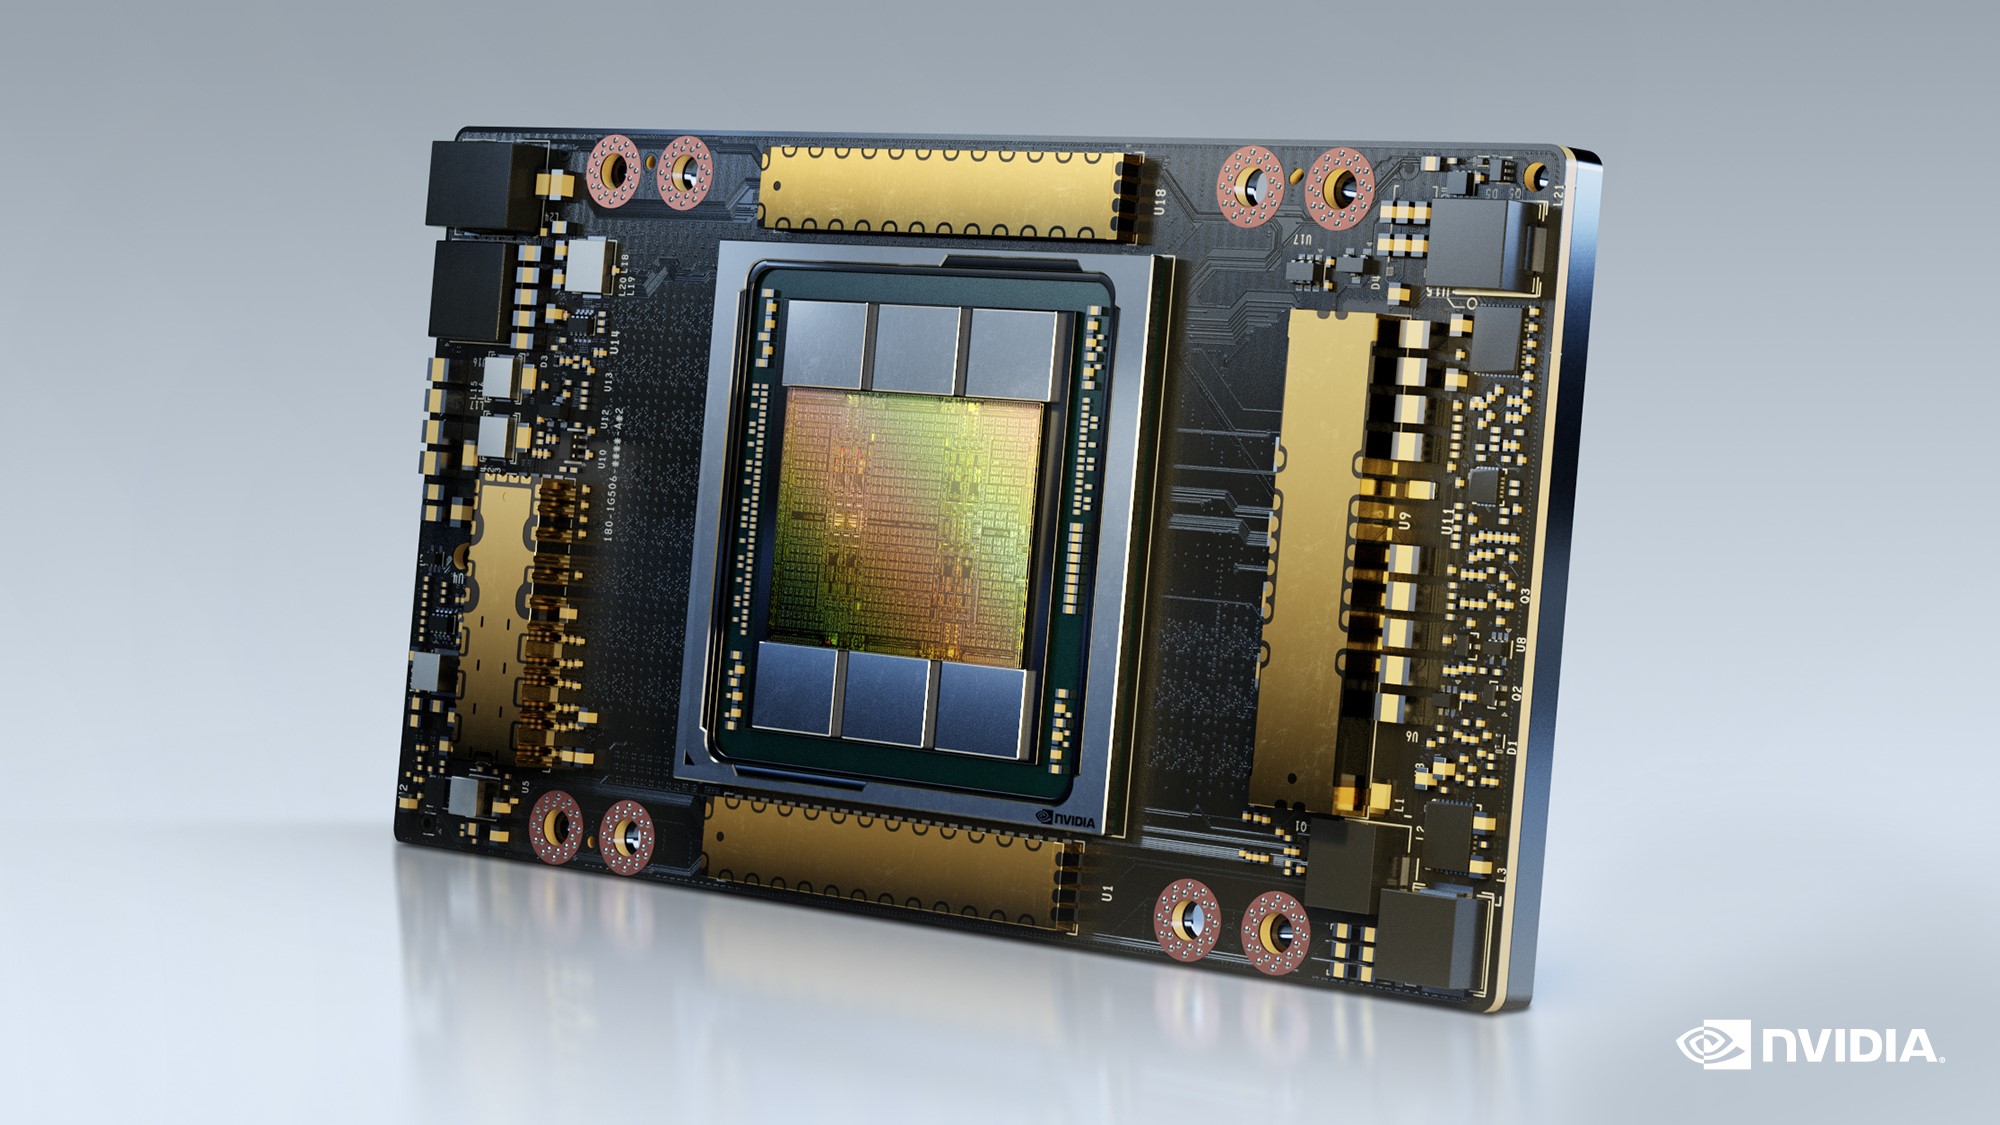
-
gpu
+關注
關注
28文章
4938瀏覽量
131193 -
內存
+關注
關注
8文章
3121瀏覽量
75238 -
模型
+關注
關注
1文章
3517瀏覽量
50383
原文標題:0x2. Flops Profiler
文章出處:【微信號:GiantPandaCV,微信公眾號:GiantPandaCV】歡迎添加關注!文章轉載請注明出處。
發布評論請先 登錄
物理內存模型的演變
【大規模語言模型:從理論到實踐】- 閱讀體驗
讓你的LabVIEW 高效運行 ——找到程序運行速度的瓶頸
藍牙耳機的支援Profile
ARM申請Full Profile OpenCL認證 實現圖形計算
內存內計算的原理以及其市場前景分析
Keil C51的內存模型有哪些?三種類型的內存模型詳細說明
通過內存中的模擬計算來消除內存瓶頸
計算內存與非計算內存有什么區別?
數據中心架構克服AI內存瓶頸的方法
設計師如何應對 AI 的內存瓶頸
使用內存VIP檢測和避免內存瓶頸


 工商網監
工商網監

評論